For affiliates, merchants and even AvantLink employees, our time is often spent in reports. Today, we’re thrilled to release an update to AvantLink that greatly increases the reporting capabilities of the network and allows you faster, more customizable access to data. We call it Performance Reports and if you’re a customization junky, this update is for you!
Before getting into specifics, let’s answer the question of ‘why’? Why should the typical AvantLink user choose to use Performance Reports over the network’s existing reporting? The short answer is for far greater customization of data displayed in reports instead of relying on the prestructured delivery options in AvantLink’s standard reports. In other words, Performance Reports provides better insight into more specific questions.
Performance Reports are found under ‘Performance’ in your account’s main navigation. Let’s break down how the system works and look at two use case examples.
Sources Of Data
![]()
The first row of options at the top of the Performance Reports screen selects the parameters around where reports source their data. For merchants, this will consist of the options to select which affiliates and dates to run reports for. For affiliates, those options are merchants and dates. You will also be able to access any saved reports you have created from the ‘My Reports’ drop down. Any report can be saved and quickly accessed under ‘My Reports’.
Grouping Of Data

A big part of customizing Performance Reports is selecting how to group your data. This is done by choosing what data groups are displayed in the rows and the columns of each report your building. The data itself won’t change when selecting different groupings, rather the way you view it.
For example, say an affiliate wants to build a report showing activity per merchant for each week this year. This affiliate initially builds the report to show the merchant name on the y-axis (vertical) and the weekly dates on the x-axis (horizontal). After running the report, the affiliate decides to adjust the data grouping and reverse how merchants and dates are shown. Now, the report shows the merchant names on the x-axis and the weekly dates on the y-axis. In this scenario the data hasn’t changed; only the way it was being arranged.
Types of Data Displayed
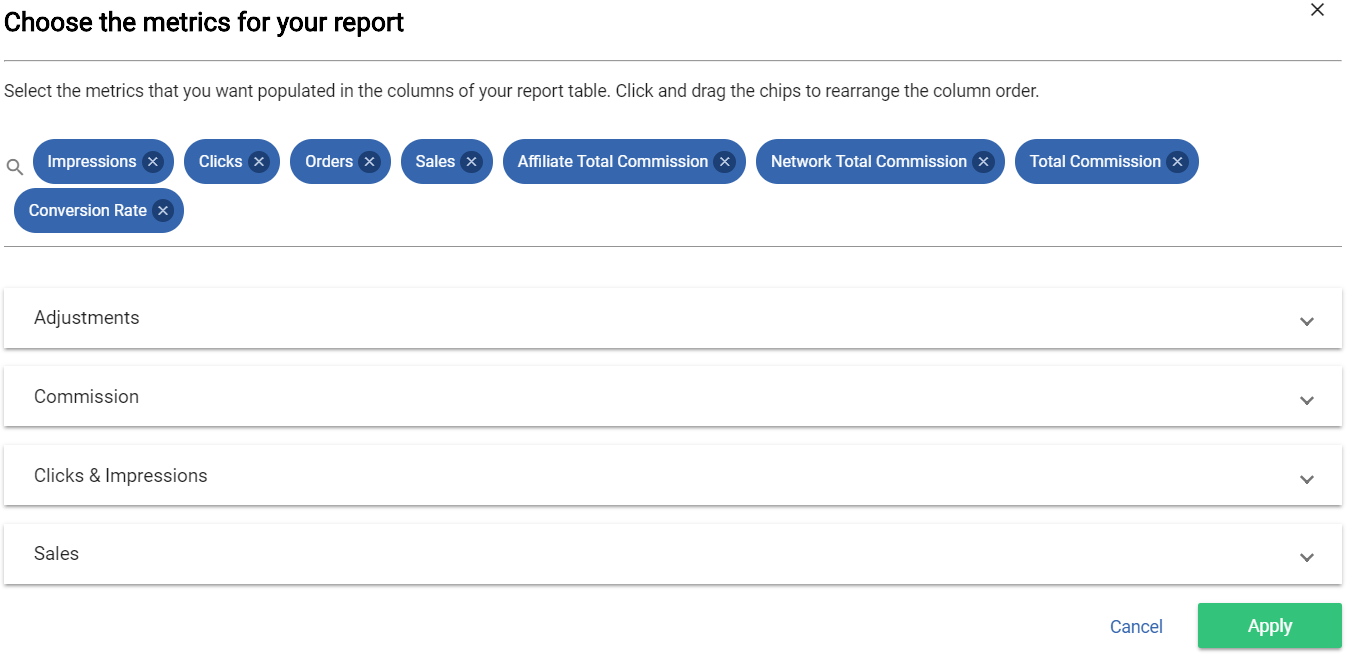
With the sources and grouping complete, users finally select what data they want to display in the report. Clicking on the Metrics button displays a significant list of available metrics in which to build your report around. Because Performance Reports build more efficiently than AvantLinks’ traditional reporting, you’re not limited on the number of data points that you would like to see within the report. Data types include:
- Clicks and Impressions
- Commissions
- Adjustments
- Sales
Future Updates To Performance Reports
The initial release of Performance Reports pairs a lot of data with a system that can compile reports of any size very quickly. Moving forward, you will have continuous access to more data in which to build reports on. This includes additional information on products, new customers, mobile sales and tool reporting. Currently, the system shows reports on data dating back to January 2016 but more historical data will be added.
Due to the way Performance Reports processes information, there is a 30-minute delay in reported data after an event has occurred. If you see a data point in the standard reporting but not the Performance Reports, give the system a few additional moments for it to display.
Affiliate Use Case Example
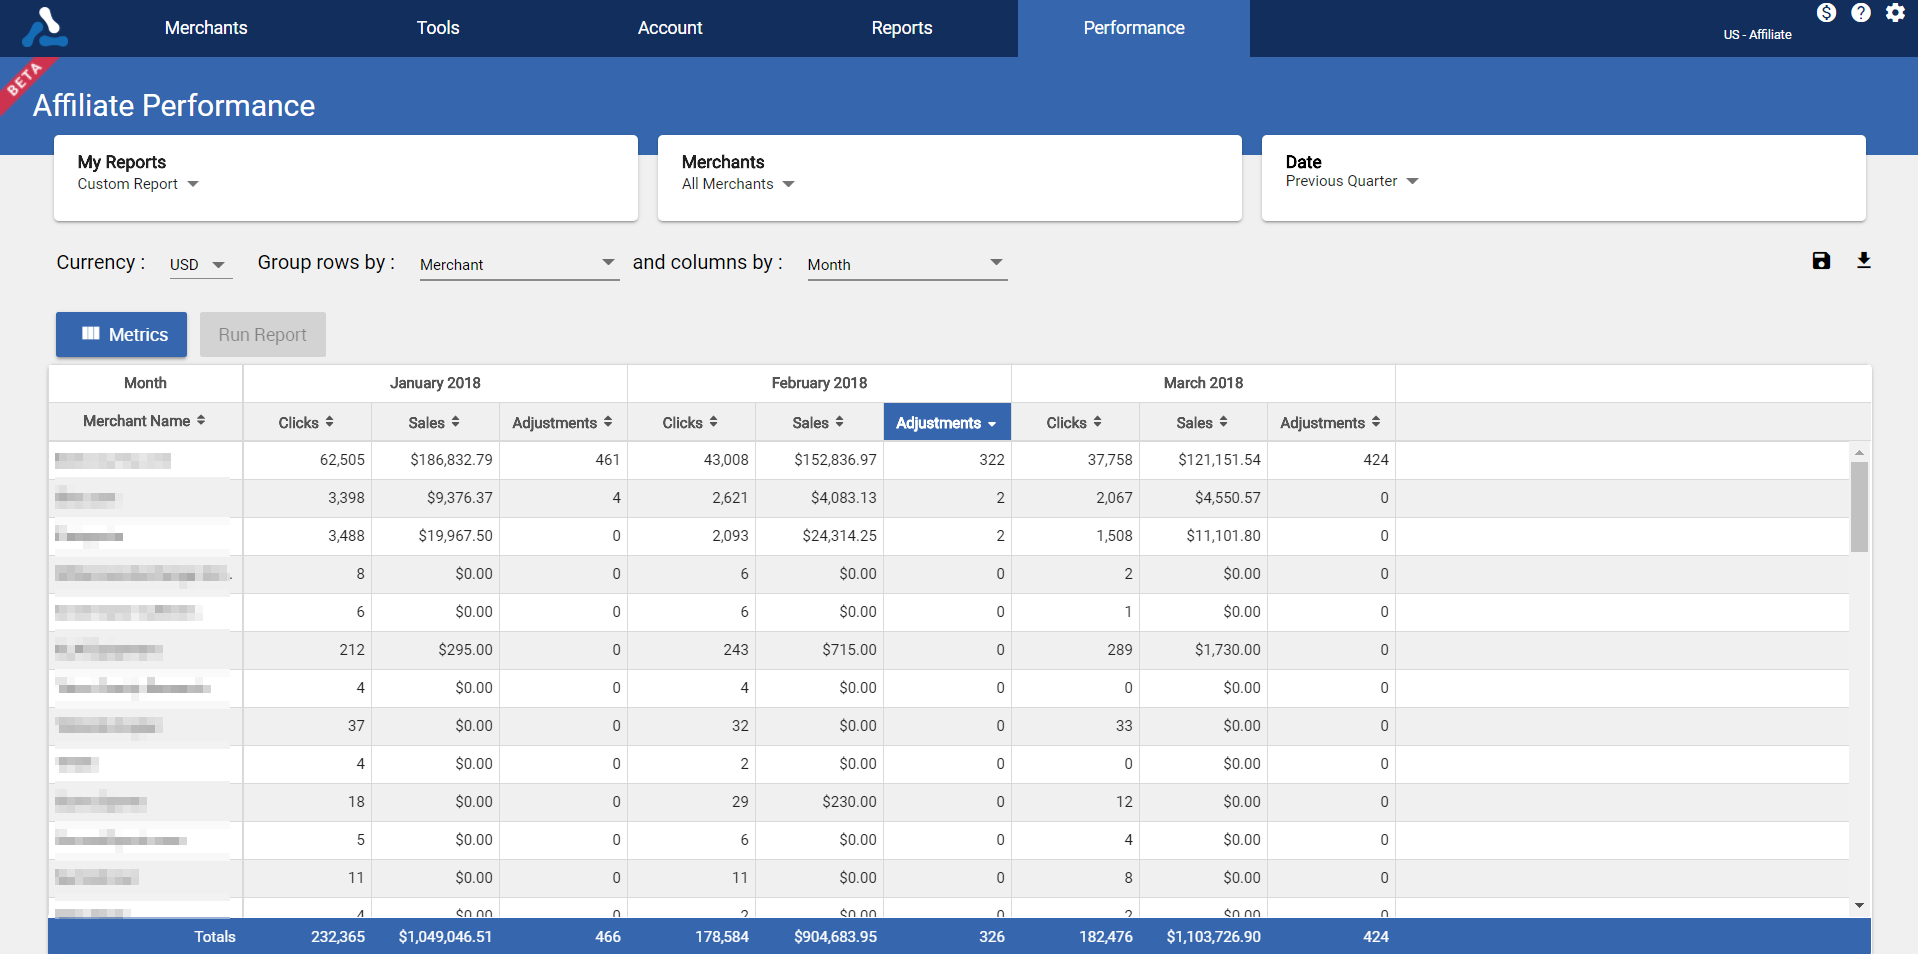
Let’s look at a use case example for an affiliate. This affiliate wants to see the correlation between the sales and clicks they drive for each of their merchants and the number of adjustments by each merchant for each month in the first quarter of this year (say that five times fast). The affiliate will start by selecting All Merchants and Previous Quarter at the top of the Performance Reports screen. The affiliate wants the report to show the merchants on the y-axis and the months on the x-axis. This is done by selecting Merchants under ‘Group Rows by’ and Months under ‘Columns by’. Finally, the affiliate selects Clicks, Sales and Adjustments as the metrics for which the report will source the data from.
This report enables the affiliate to compare adjustments based on their performance per merchant during each month of Q1.
Merchant Use Case Example
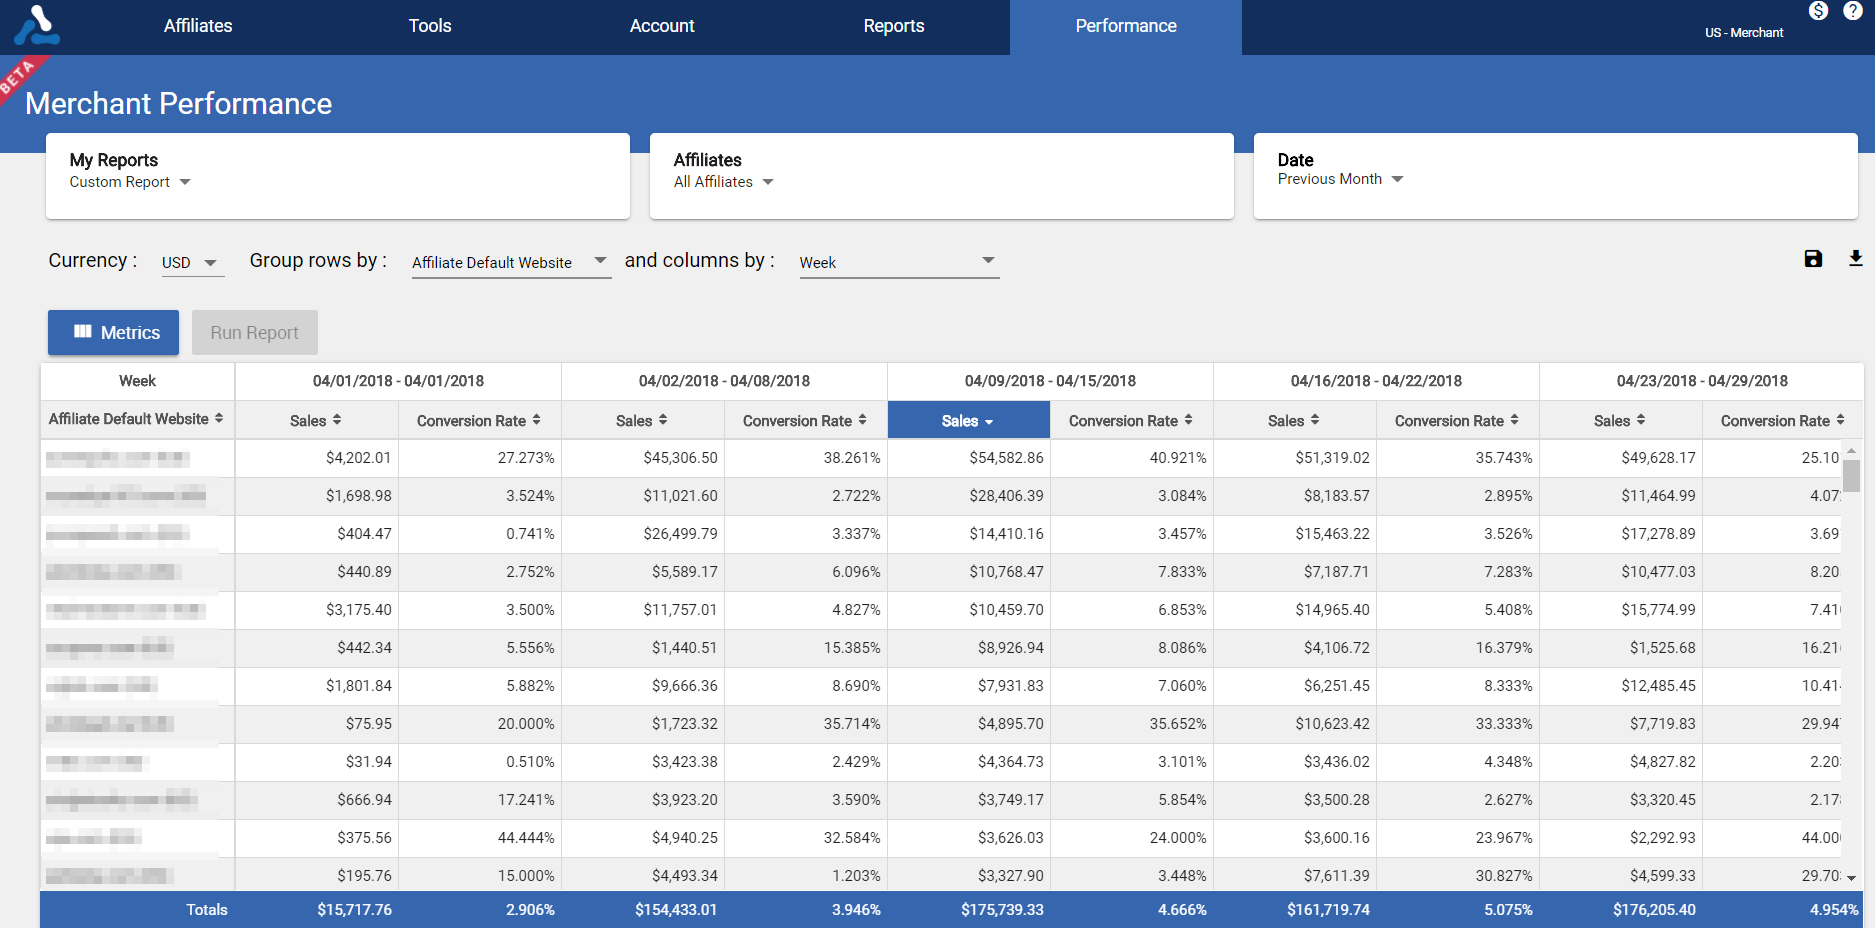
A merchant is looking to see sales and conversion rate data per affiliate for each week during the last month. This merchant starts by selecting All Affiliates and Last Month as the sources of data. Because there are more affiliates in their program than there are weeks in April, the merchant groups the data by putting the affiliates on the y-axis of the report and week timeframes in the x-axis. Finally, the Sales and Conversion Rate metrics are selected as the data that will display for each affiliate for each week in April.
The end result is a report that shows the conversion rate and sales total for each affiliate for each week in April.